Laser Welding FPCB: Effects of Welding Time, Pressure, and Temperature on Joint Quality

Laser welding is a precision machining technology that uses a high-energy-density laser beam to join materials.
Its core principle involves using the focused energy of the laser beam to locally melt metal, which then rapidly cools and solidifies, bonding the atoms of the materials together to form a permanent joint.
Compared to traditional soldering processes (such as wave soldering, reflow soldering, and hot-press soldering), laser welding offers advantages such as rapid heating, precise control of the welding position, and consistent welding results.
Laser welding employs a non-contact welding method, capable of focusing heat onto an extremely small spot and precisely positioning it at the designated location for welding.
It can also generate very short light pulses to perform solderless welding, with a welding speed faster than the rate of oxidation reactions.
In situations where automated welding machines cannot access the area, laser welding demonstrates greater flexibility.
This paper investigates the laser welding of flexible printed circuit boards (FPCBs) based on the principles of laser welding.
It aims to verify the stability of the laser welding process and assess the impact of welding parameters on quality, while identifying optimal welding conditions to improve FPCB yield rates.
Principles of Laser Welding
Laser welding uses a laser as the heat source. A laser, such as a fiber laser, CO₂ laser, or YAG laser, generates a monochromatic, high-energy, highly directional laser beam.
Lenses or mirrors focus this beam into an extremely small micrometer-scale spot, producing an energy density of 10⁶–10⁸ W/cm².
The beam heats the solder pads through radiation. Heat then transfers through the solder to the substrate.
When the temperature reaches the welding threshold, the solder melts, wetting the substrate pads, and the molten solder flows into adjacent areas, forming a solder joint upon cooling.
The laser equipment uses a glass pressure block.
During laser welding, the system presses down the glass pressure block to apply pressure to FPC1 and FPC2.
The laser beam passes through the glass pressure block and focuses directly onto FPC2, as shown in Figure 1.

Figure 1: Cross-section illustrating the principle of laser welding
After laser welding, the melted solder joins FPC1 and FPC2, as shown in Figure 2.
Engineers assess weld quality using data such as pull-off force between FPC1 and FPC2, contact resistance, and solder coverage area on the pads.

Figure 2: Cross-sectional view and photograph of the laser-welded joint
Test Section
Test Materials and Equipment
(1) Selected Test Materials:
① The test uses a single-sided flexible copper-clad laminate (FCCL-1), which includes a 25 μm polyimide (PI) film, a 25 μm epoxy adhesive (AD), and a 35 μm copper foil (Cu), as shown in Figure 3(a).
② Double-sided flexible copper-clad laminate (FCCL-2): Select a standard 25 μm PI substrate, without AD adhesive, and 18 μm Cu, as shown in Figure 3(b).
③ Cover Film: Select a standard 25 μm PI substrate with 25 μm AD adhesive, as shown in Figure 3(c).

Figure 3: Schematic diagram of the test material stack-up
(2) Equipment: Dedicated laser welding equipment, AOI inspection equipment, tensile testing machine, four-wire probe-type DC low-resistance tester.
Experimental Design
1. Test Samples
The process fabricates FPC1 using FCCL1 with pad dimensions of 2.3 mm × 2.3 mm and then applies a cover film, as shown in Figure 4(a).
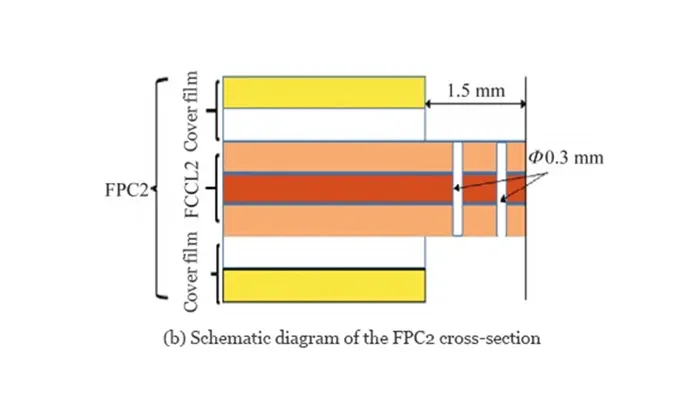
The process also fabricates FPC2 using FCCL2 and then applies a cover film, with pad and via sizes shown in Figure 4(b).

Figure 4: Schematic diagram of the test specimen structure
2. Laser Welding Process Flow
① Load FPC1;
② Apply solder to the pads on FPC1;
③ Position FPC2 so that the welding locations align.
④ The glass clamping block is lowered to apply pressure, and the laser is activated to emit the laser beam.
⑤ Adjust the laser welding time, temperature, and pressure; test the contact resistance, pull-out force, and solder coverage area to verify weld quality.
Testing Process, Results Recording, and Analysis
Testing Methods
Engineers assess the quality of laser welding by measuring post-weld electrical resistance, pull-out force, and tin coverage rate of the pads.
The degree of solder flow determines the post-welding electrical resistance, pull-out force, and the tin coverage rate of the pads.
A low-resistance tester measures post-welding electrical resistance. A tensile testing machine measures pull-out force.
Specialized testing equipment measures the tin coverage rate of the pads. Figure 5 illustrates the testing procedures.

Figure 5: Schematic diagram of solder paste area detection
Explanation of solder coverage area for pads:
(1) Solder coverage rate = (Actual soldered area of the pad / Total area of the pad) × 100%;
(2) Actual soldered area of the pad ≤ Solderable area of the pad = Total area of the pad – Area of the pad that is obscured;
(3) Total area of the pad = Area of the FPC1 pad.
Test Results and Analysis
1. Testing the Effects of Laser Welding Time on Post-Weld Pull-Out Force, Contact Resistance, and Solder Coverage
With the welding pressure (4 N) and welding temperature (260 °C) held constant, the laser welding time was varied to test its effects on post-weld pull-out force, contact resistance, and solder coverage on the pads. The welding time was set to 1–8 seconds, with a total of 8 levels.
(1) Trend in post-weld pull-out force.
Ten sets of pull-out force data were collected for each test scenario (Note: The data reported for each scenario consists of 10 sets). As shown in Box Plot 6, the post-weld pull-out force increases as the laser welding time increases, gradually stabilizing.
When the laser welding time is set to ≥3.5 s, the post-weld pull-out force is at its maximum, and the variation range is minimal.
(2) Trend in the tin coverage area ratio on the pads.
As shown in Figure 7, as the laser welding time increases, the tin coverage ratio on the pads also increases, gradually stabilizing.
When the laser welding time is set to ≥3.5 s, the tin coverage ratio on the pads is at its maximum, the variation range is smallest, and the test data is most concentrated.

Figure 6: Trend of post-weld tensile strength as a function of laser welding time

Figure 7: Trend in the area of solder coverage on the pad as a function of laser welding time
Comparison of solder coverage on pads for three laser welding scenarios with durations of 1.5 s, 2.5 s, and 3.5 s: At 1.5 s, the solder coverage on the pad is 45%; at 2.5 s, it is 70%; and 85% at 3.5 s. At 3.5 s, the pads are fully covered with solder, meeting the optimal quality requirements; therefore, a laser welding time of ≥3.5 s is the preferred parameter.
(3) Trends in post-welding contact resistance.
As shown in Figure 8, as the laser welding time increases, the post-welding contact resistance decreases and gradually stabilizes.
When the laser welding time reaches ≥3.5 s, the post-welding contact resistance becomes minimal.
At the same time, the variation range decreases to the smallest level, and the test data becomes most concentrated.

Figure 8: Trend of post-welding contact resistance as a function of laser welding time
A comparison of post-weld pull-out force, contact resistance, and solder coverage area identifies the optimal laser welding time.
The analysis determines that a laser welding time of ≥3.5 s provides the best overall performance.
2. Testing the Effects of Laser Welding Pressure on Post-Weld Pull-Out Force, Contact Resistance, and Solder Coverage
Based on the previous subsection results, the analysis sets the optimal laser welding time at 3.5 s under a fixed welding temperature of 260 °C.
The analysis then evaluates how varying laser welding pressure affects post-weld pull-out force, contact resistance, and solder coverage.
Welding pressure was varied from 1 to 8 N, with a total of 8 levels.
(1) Trends in Post-Weld Pull-Out Force.
Figure 9 presents the measured post-weld pull-out force data.
As the laser welding pressure increases, the pull-out force data becomes most concentrated at 3 N, 4 N, and 5 N, showing the smallest variation range.

Figure 9: Trend of post-welding pull-out force as a function of laser welding pressure settings
(2) Trends in solder coverage on the pads.
Figure 10 shows how the solder coverage on the tested pads varies with changes in laser welding pressure.
As the laser welding pressure increases, the solder coverage on the pads increases accordingly and gradually stabilizes.
When the laser welding pressure is set to ≥4 N, the data for solder coverage on the pads is most concentrated, and the range of variation is smallest.

Figure 10: Trend in solder coverage on the pad as a function of laser welding pressure settings
Three laser welding pressure settings—1 N, 4 N, and 8 N—serve to compare solder coverage on the pads.
At 1 N, insufficient pressure limits solder flow onto the top of the pad. At 4 N, moderate pressure enables relatively full solder coverage on the top of the pad.
8 N, excessive pressure forces the solder to squeeze out. At 4 N, solder fully covers all four edges of the pad and fills the top surface well without overflow, meeting the optimal quality requirements.
Therefore, a laser welding pressure of 4 N is the preferred parameter.
(3) Trends in post-welding continuity resistance.
The variation in continuity resistance after welding as a function of laser welding pressure is shown in Figure 11.
As the laser welding pressure increases, the continuity resistance decreases and gradually stabilizes.
When the laser welding pressure reaches ≥4 N, the continuity resistance values remain similar and show minimal variation.
A comprehensive comparison of post-welding pull-out force, electrical resistance, and solder coverage area identifies a laser welding pressure of 4–5 N as the optimal condition.

Figure 11: Post-welding contact resistance as a function of laser welding pressure settings
3. Testing the Effects of Laser Welding Temperature on Post-Weld Pull-Out Force, Contact Resistance, and Solder Coverage
Building on the previous two tests, with the laser welding time fixed at 3.5 s and the laser welding pressure at 4 N, we tested the effects of varying laser welding temperatures on post-weld pull-out force, contact resistance, and solder coverage.
The laser welding temperature varied between 230 and 300 °C across a total of 8 levels.
(1) Trends in post-weld pull-out force.
As shown in the box plot of post-weld pull-out force data in Figure 12, under fixed laser welding time and pressure conditions, as the laser welding temperature increases, the post-weld pull-out force increases accordingly and gradually stabilizes.
When the laser welding temperature reaches ≥260 °C, the pull-out force data remains similar and shows very little variation.
The laser beam directly heats the pad and transfers heat to the solder. Lower temperatures limit solder melting and reduce welding quality.

Figure 12: Post-weld tensile strength as a function of laser welding temperature settings
(2) Trends in solder coverage on the pads.
The data on solder coverage on the tested pads indicates that, under fixed laser welding time and pressure conditions, solder coverage increases as the laser welding temperature rises, eventually stabilizing.
When the laser welding temperature reaches ≥260 °C, the solder coverage on each group of tested pads reaches the maximum level.
At the same time, the data points remain similar and show very little variation. As shown in Figure 13.

Figure 13: Solder coverage on the pad as a function of laser welding temperature settings
(3) Trends in post-welding electrical resistance.
The post-welding electrical resistance data indicate that, under fixed laser welding time and pressure conditions, the electrical resistance decreases as the laser welding temperature increases and gradually stabilizes.
When the laser welding temperature reaches ≥260 °C, the electrical resistance drops to the lowest level, and the values show very little variation. See Figure 14.

Figure 14: Post-welding contact resistance as a function of laser welding temperature settings
Conclusion
This paper analyzes and tests the relevant conditions for laser welding on FPCBs.
It examines the effects of three process parameters during the welding process—laser welding time, laser welding pressure, and laser welding temperature—on post-welding pull-out force, contact resistance, and tin coverage area. The conclusions are as follows:
Effect of Laser Welding Time on Joint Performance and Solder Flow
When the laser welding temperature and pressure are held constant, both the post-weld pull-out force and the solder coverage area on the pads gradually increase as the laser welding time increases, while the contact resistance gradually decreases, eventually stabilizing.
Laser welding time determines the degree of solder flow (Figure 8). The shorter the laser welding time, the less solder flows, resulting in lower pull-out force between the FPCBs, higher contact resistance, and a smaller solder coverage area, which affects the final electrical connectivity.
Effect of Welding Pressure on Joint Quality and Solder Appearance
Increasing laser welding pressure raises the post-weld pull-off force and enlarges the solder coverage area on the pads.
At the same time, increasing pressure reduces contact resistance while the laser welding temperature and time remain constant.
Additionally, laser welding pressure significantly affects the visual appearance of the weld, as shown in Figure 13.
Increasing welding pressure squeezes solder out of the pads and reduces visual quality.
Therefore, selecting an appropriate welding pressure according to the reference parameters of the welding equipment remains essential.
Effect of Welding Temperature and Solder Flow on Weld Quality
Similarly, when the laser welding time and pressure are constant, the post-weld pull-out force and the tin coverage area on the pad increase with rising laser welding temperature, while the contact resistance decreases.
However, solder possesses unique physical properties: if the temperature does not reach the solder’s melting point, a solder joint cannot form, and the weld will fail; conversely, excessively high temperatures can damage the FPC, leading to quality defects. Therefore, selecting an appropriate welding temperature is critical.
Based on the above analysis, it is evident that the flow of solder during the laser welding process determines the quality of the weld, and this flow is related to the laser welding temperature, duration, and pressure.
Given the wide variety of laser welding equipment available, it is necessary to test the laser welding duration, pressure, and temperature before use to select the optimal combination of parameters.