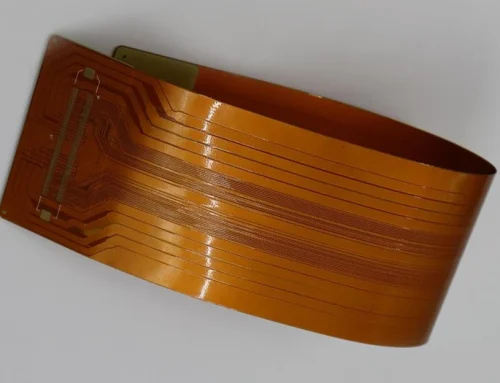
Rigid-Flex PCB Air-Gap Process Optimization for High-Yield Flexible Circuit Manufacturing(Part II)

Back to Part 1 «
Evaluation by replacing dry film with a wet film with better flow properties
Liquid ink shows good filling and flow properties. It is expected to effectively fill the pits at the bottom of the copper surface in the air gap.
However, the ink requires high exposure energy. The process cannot remove residual ink during the stripping stage after development.
Therefore, the process requires a material. The material must provide the flow and filling properties of ink.
The material must also match the exposure energy of the dry film. In addition, the process must remove the material during the stripping stage.
Material Screening and Initial Evaluation
Preliminary testing evaluated two photosensitive wet film inks that meet the above technical requirements: Taiyang PPR-50 EB02 and Rongda A-9000. The results are shown in Table 10:

Table 10: Comparison of Different Photosensitive Wet Films
Based on the experimental results, when the oil thickness was kept constant, there was a significant difference in the wet film line width between the two products. Rongda A-9000 outperformed Taiyang PPR-50 EB02; therefore, subsequent
tests will use Rongda Wet Film A-9000 as the subject of study.
Main process flow for full-panel wet film production: chemical cleaning → screen printing of wet film (full panel) → baking → exposure → development → etching → AOI

Figure 14: Schematic diagram of wet film packing
| Process Step | Parameter | Setting |
|---|---|---|
| Chemical Cleaning | Line Speed | 3.0 m/min |
| Screen Printing | Thickness | 15 ± 5 μm |
| Baking | Time | 25 min |
| Exposure | Exposure Energy | 150 mJ |
| Development | Line Speed | 2.5 m/min |
| Etching | Line Speed | 2.1 m/min |
Table 11: Main Parameters of Dry Film Process

Figure 15: Wet Film Process—Yield Pareto Chart

Figure 16: Wet Film Method—Illustration of Poor Sealing
Full-Board Wet Film Test Results and Failure Analysis
The results of the full-board pure wet film test show that the SET yield is only 37%.
As shown in the Pareto chart in Figure 15, poor via plating (see Figure 16), notches, and short circuits accounted for 80% of the defects, representing the primary causes affecting the test board yield, with poor via plating being the most significant factor.
Therefore, the team concluded that the wet film can effectively fill the copper pits at the bottom of the air gap (delamination).
However, the wet film shows poor via plating capability. This poor capability leads to over-etching of the via openings during etching.
Attempts to increase the wet film thickness to 25±5 μm still failed to resolve the poor sealing issue.
Based on the above test protocols—including conventional film application processes, dry film back-pressing, and full-board wet film application—none of these methods effectively mitigated defects caused by delamination (air gaps) or step-out in via plating.
Consequently, the process requires a method that overcomes the depression in the delamination (air gap) area and ensures adequate via sealing capability.
Study was conducted using a wet film + dry film approach.
The wet film exhibits good flow and filling properties, capable of filling the copper pits on the bottom surface of the air-gap (delamination) zone;
however, its pore-sealing ability is poor, and it cannot protect the through-holes during circuit fabrication.
Dry film offers excellent sealing capability but has limited filling capacity; it cannot fill the pits on the bottom surface of the air-gap (layered) area or compensate for the height differences in the through-hole regions.
Proposed Hybrid Process
Therefore, the team proposes a combination method. The method applies wet film first and then applies dry film. The test process is as follows:
Chemical cleaning → Screen printing of wet film (air-gap area) → Baking → Film lamination → Exposure → Development → Etching → AOI

Figure 20: Schematic diagram of the screen-printed wet film area

Figure 21: Conventional dry film process flow
The document presents the main test parameters in Table 12.
Note: The standard development speed for AQ-4088 (40 μm thickness) is 1.8 m/min.
Considering both the development spot size and the total developed film thickness, the process team selected a development speed of 1.5 m/min.
Note: When comparing different wet film thicknesses, the line width results under 15±5 μm conditions were closer to the target line width range (102±20 μm), as shown in Table 13.
Results and Optimization
Based on the above experiments, the method of first screen-printing the wet film and then applying the dry film in the air-gap (layered) area effectively mitigates defects such as gaps and poor exposure in the air-gap region.
At the same time, the thickness of the wet film affects circuit fabrication; the thicker the wet film, the weaker the resolution, leading to poor exposure and line width deviations from specifications.
Validation tests confirmed the best results with a wet film thickness of 15±5 μm.
The team established the key processes and parameters for the optimal test scheme based on these results. The final configuration is shown in Table 14.
| No. | Roughening Line Speed (m/min) | Screen Printing Wet Film Thickness (μm) | Baking Time | Dry Film Model | Exposure Energy | Development Speed (m/min) | Etching Speed (m/min) |
|---|---|---|---|---|---|---|---|
| 1 | 3.0 | 15 ± 5 | 25 min | AQ-4088 | 80 | 1.5 | 2.1 |
| 2 | 3.0 | 25 ± 5 | 25 min | AQ-4088 | 80 | 1.5 | 2.1 |
Table 12: Main Parameters

Table 13: Experimental Results for Different Wet Film Thicknesses
| Process Step | Optimal Parameters & Conditions | Remarks |
|---|---|---|
| Pre-treatment | Micro-etching / Line speed 3 m/min | / |
| Screen Printing | Thickness 15 ± 5 μm | / |
| Lamination | Dry film thickness 40 μm | Wet lamination, no re-press |
| Lamination direction: vertical |
Table 14: Optimal Test Parameters and Conditions
Further Optimization of Parameters for the Wet-Film + Dry-Film Process
According to Table 14, the batch validation yield for SET was 89.34%. The defects are as follows:

Figure 22: Wet Film + Dry Film Process Flow

Figure 23: Defect Pareto chart for the wet film + dry film scheme

Table 15: Analysis of Major Defects and Re optimization of Process Parameters
Validation Results: The team conducted a batch validation on 20 lots. The team based the validation on the optimized production conditions and design. The test results are as follows:

Figure 24 Comparison of Yield Rates Before and After Optimization

Figure 25 Comparison of Defect and Reject Rates Before and After Optimization
As shown by the comparison in Figures 24 and 25, after parameter and design optimization, the SET yield improved from 89.36% to 95.70%, representing an overall increase of 6.34%.
Meanwhile, the top three defects—short circuits, exposure defects, and open circuits—showed significant improvements: short circuits decreased from 6.2% to 5.37%, exposure defects decreased from 4.0% to 1.27%, and open circuits decreased from 3.0% to 1.04%.
Research on Vacuum Laminating Machines
Purpose of vacuum lamination: The process removes air bubbles on products with uneven surfaces or indentations.
The system adheres the dry film to the substrate surface by creating a vacuum in the lamination chamber. The system applies heat and pressure during the lamination process.
Process flow of a vacuum laminating machine: Board loading → Pre-lamination → Vacuum lamination → Board unloading

Table 16: Product illustrations for each section of the vacuum laminating machine

Figure 26: Comparison of Conventional Film Application and Vacuum Film Application Processes
| Temperature | Vacuum Time (s) | Pressing Time (s) | Pressure (MPa) |
|---|---|---|---|
| 65 °C | 25 | 30 | 0.6 |
Table 17: Vacuum Lamination Parameters

Figure 27: Comparison of experimental results between conventional film application and vacuum film application
As shown in the experimental results in Figure 27, the overall SET yield improved by an additional 2.05% when using a vacuum lamination machine.
Note that no wet lamination process was applied during vacuum lamination.
The process team used the original process and parameters as the basis. The team changed the dry lamination method from conventional lamination to vacuum lamination.
Conclusion
In the initial experiments described in this paper, conventional circuit fabrication methods—including various pre-treatment processes for circuits, different dry film thicknesses, panel lamination methods, and dry film back pressure—failed to resolve circuit defects caused by delamination (air gaps) in rigid-flex board designs and variations in via plating step heights.
Initial Process Evaluation and Optimization Strategy
However, the combination of 40 μm thick dry film, ultra-coarse etching, and vertical film lamination emerged as the most effective solution.
When pure wet film or dry film processes alone could not meet manufacturing requirements, mid-stage experiments explored a hybrid wet-film and dry-film process.
After considering actual circuit design needs, process control parameters were evaluated.
These parameters included the selection of photosensitive wet film, control of wet film thickness, definition of wet film application areas, and management of dwell time during the dry film process.
Based on this evaluation, the process team determined the optimal wet-film + dry-film process.
Key Process Control Parameters and Validation Results
The key control parameters are: controlling wet film thickness to 15 ± 5 μm, ensuring the dwell time between the wet film and dry film development is less than 12 hours, and applying the wet film to cover both the air gaps and the plating steps.
Batch verification confirmed that this approach effectively reduced defects such as open circuits and exposure defects caused by air gaps and hole plating steps.
This improved the SET yield for the target product model from 87.4% in initial pilot boards to 95.7%, reducing the scrap rate by 8.3%. Subsequently, by introducing a vacuum lamination machine and using only the dry film process, the SET yield further improved by 2.05%, effectively overcoming the challenges posed by air-gap design.
The pattern fabrication method described in this paper provides a process reference for addressing the fabrication of circuit patterns in air-gap regions of the flexible layer in rigid-flex boards.